Annual Water Quality Report
In 2025, the City of Bend Water Department met or exceeded all federal and state requirements to provide our customers with safe, reliable drinking water. The report below details how the City of Bend remains committed to producing and delivering high-quality drinking water to our community day after day.
About the Report
In 2025, City of Bend Water, (Water System ID OR41 00100), met or exceeded all federal and state requirements to provide our customers with safe, reliable drinking water. This report details how the City of Bend remains committed to producing and delivering high-quality drinking water to our community day after day.
This report provides important information about the quality of our drinking water, an explanation of where our water comes from, and tips on how to interpret the data in this report. The data presented is for Jan. 1 through Dec. 31, 2025, unless otherwise noted.
Please share this information with anyone who drinks this water (or their guardians), especially those who may not have received this report directly (for example, people in apartments, nursing homes, schools, and businesses). You can do this by posting this report in a public place or distributing copies by hand, mail, email, or another method.
If you would like printed copies, please call 541-317-3000, ext. 2, or:
From the Director

This year’s Water Quality Report comes at a meaningful moment for our community. In 2026, we’re celebrating 100 Years of Water in Bend — a century of exceptional water service supported by strong stewardship, careful planning and a shared commitment to protecting the resources we all depend on.
This report gives you a clear look at where your drinking water comes from, how we treat and monitor it and the results of the rigorous testing we conduct throughout the year to make sure we meet and exceed drinking water standards. You’ll find details about our surface water from the Bend Municipal Watershed, our groundwater from the Deschutes Regional Aquifer and the steps we take every day to ensure our community’s water — your water — remains safe, clean and reliable.
As we recognize a century of progress, I’m especially proud of the dedicated people behind this work — the operators, engineers, technicians and staff who safeguard Bend’s drinking water around the clock. Their expertise and care are the reason we’re able to celebrate both our history and our future with confidence.
Thank you for your continued trust in us. It’s an honor to provide high‑quality water to our community, today and for the next century ahead.
— Mike Buettner,
Public Works Director
2025 Water Quality Information
Health Information from the EPA and CDC
Potential Contaminants
Drinking water, including bottled water, may reasonably be expected to contain at least small amounts of some contaminants. The presence of contaminants does not necessarily indicate that water poses a health risk. More information about contaminants and potential health effects can be obtained by calling the EPA’s Safe Drinking Water Hotline at 1-800-426-4791.
Some people may be more vulnerable to contaminants in drinking water than the general population. Immuno-compromised persons such as persons with cancer undergoing chemotherapy, persons who have undergone organ transplants, people with HIV/AIDS or other immune system disorders, some elderly, and infants can be particularly at risk from infections. These people should seek advice about drinking water from their health care providers. EPA/CDC guidelines on appropriate means to lessen the risk of infection by Cryptosporidium and other microbial contaminants are available from the Safe Drinking Water Hotline at 1-800-426-4791.
Types of Contaminants
- Microbial Contaminants: Viruses and bacteria from sewage plants, septic systems, farms, and wildlife.
- Pesticides and Herbicides: From farms, stormwater runoff, and homes.
- Inorganic Contaminants: Salts and metals from natural sources, stormwater, wastewater, or farming.
- Organic Chemical Contaminants: Byproducts of industrial processes, gas stations, stormwater, and septic systems.
- Radioactive Contaminants: From natural sources or oil and gas production and mining.
To ensure that tap water is safe to drink, EPA prescribes regulations that limit the amount of certain contaminants in water provided by public water systems. Food and Drug Administration regulations establish limits for contaminants in bottled water which must provide the same protections for public health.
Information for Immunocompromised Persons
Some people are more at risk from contaminants in drinking water. This includes those with cancer, organ transplants, HIV/AIDS, immune system disorders, some elderly, and infants. They should ask their doctors about safe drinking water. Guidelines to reduce infection risk are available from the Safe Drinking Water Hotline at 1-800-426-4791.
Lead
Lead can cause serious health problems, especially for pregnant women and young children. Lead in drinking water is primarily from materials and components associated with service lines and home plumbing. Bend Water is responsible for providing high quality drinking water and removing lead pipes but cannot control the variety of materials used in plumbing components in your home. You share the responsibility for protecting yourself and your family from the lead in your home plumbing. You can take responsibility by identifying and removing lead materials within your home plumbing and taking steps to reduce your family’s risk. Before drinking tap water, flush your pipes for several minutes by running your tap, taking a shower, doing laundry or a load of dishes. You can also use a filter certified by an American National Standards Institute accredited certifier to reduce lead in drinking water. If you are concerned about lead in your water and wish to have your water tested, contact Bend Water at 541-317-3000, ext. 2. Information on lead in drinking water, testing methods, and steps you can take to minimize exposure is available at epa.gov/safewater/lead.
In 2024, City of Bend Water completed a service line inventory using approved statistical analysis and determined it has zero (0) lead or galvanized-requiring-replacement service lines of the 30,634 service lines inventoried.
Arsenic
While your drinking water meets EPA’s standard for arsenic, it does contain low levels of arsenic. EPA’s standard balances the current understanding of arsenic’s possible health effects against the costs of removing arsenic from drinking water. EPA continues to research the health effects of low levels of arsenic, which is a mineral known to cause cancer in humans at high concentrations and is linked to other health effects such as skin damage and circulatory problems.
Definitions and Units of Measure
- Action Level: The concentration of a contaminant which, if exceeded, triggers treatment or other requirements that a water system must follow.
- Maximum Contaminant Level (MCL): The highest level of a contaminant that is allowed in drinking water. MCLs are set as close to the MCLGs as feasible using the best available treatment technology.
- Maximum Contaminant Level Goal (MCLG): The level of a contaminant in drinking water below which there is no known or expected risk to health. MCLGs allow for a margin of safety.
- Maximum Residual Disinfectant Level (MRDL): The highest level of disinfectant allowed in drinking water. There is convincing evidence that the addition of a disinfectant is necessary for the control of microbial contaminants.
- Maximum Residual Disinfectant Level Goal (MRDLG): The level of a drinking water disinfectant below which there is no known or expected risk to health. MRDLGs do not reflect the benefits of the use of disinfectants to control microbial contamination.
- Most Probable Number (MPN): A method used to estimate the concentration of microorganisms.
- Nephelometric Turbidity Unit (NTU): A measure of water’s clarity (turbidity).
- Not Applicable (N/A)
- Not Detected (ND): Substance not detectable using current monitoring equipment.
- Part per Million (ppm): Also known as milligrams per liter (mg/L) which is equal to the number of milligrams of a substance in one liter of water. One part per million is equal to 1,000 parts per billion.
- Part per Billion (ppb): Also known as micrograms per liter (μg/L) which is equal to the number of micrograms of a substance in one liter of water.
- Part per Trillion (ppt): Also known as nanograms per liter (ng/L) which is equal to the number of nanograms of a substance in one liter of water.
- 90th Percentile: This means that 90 percent of the samples collected were equal to or below the value reported.
- Treatment Technique: A required process intended to reduce the level of a contaminant in drinking water.
For more definitions and tips to understanding your water quality report, visit the EPA website.
2025 Water Testing Results
Regulated and Unregulated Substances Detected in 2025
The City of Bend Water Services Department checks for over 130 different contaminants in its water sources all year. This includes things like lead, copper, minerals, pesticides, and radioactive materials. Some of these contaminants have been found and are listed in this report.
Unregulated contaminants are those that don’t yet have a drinking water standard set by EPA. The purpose of monitoring for these contaminants is to help EPA decide whether the contaminants should have a standard. The Bend Water Department monitors unregulated contaminants under the EPA’s Unregulated Contaminant Monitoring Rule (UCMR). The latest sampling under the Fifth Unregulated Contaminant Monitoring Rule (UCMR 5) began in 2023 and concluded in 2024. UCMR 5 test results and data for the Bend Water Department and other public water systems is available for review through the EPA website.
For further information, you may also call EPA’s Safe Drinking Water Hotline at 1-800-426-4791.
PFAS
The EPA has established Maximum Contaminant Levels (MCLs) for certain per- and polyfluoroalkyl substances, more commonly referred to as PFAS. The MCLs for PFAS will go into effect in 2029.
During UCMR 5 monitoring, one of Bend’s eight groundwater sources, Copperstone Well #1, was found to contain small amounts of some PFAS. Copperstone Well #1 was removed from regular service and further monitored for PFAS. Details of the 2025 PFAS monitoring are included in the table above. Some of the detections of PFAS are above state and federal health advisory limits. Copperstone Well #1 was placed in ‘emergency’ status in July 2025 and will only be utilized if an emergency need arises. Work is ongoing to isolate and remove PFAS contamination from Copperstone Well #1.
2025 Testing Table
Surface Water from Bend Municipal Watershed, Bridge Creek
| Regulated Contaminant | Minimum Amount Detected | Maximum Amount Detected | MCL, Action Level, Treatment Technique or MRDL | MCLG or MRDLG | Typical Source of Substance | In Compliance? | |
|---|---|---|---|---|---|---|---|
Total Organic Carbon | ND | 0.5 ppm | Treatment Technique | N/A | Naturally present in the environment | YES | |
Turbidity | 0.01 NTU | 0.2 NTU | Must be less than or equal to 0.30 NTU in at least 95 percent of the measurements taken each month. Must at no time exceed 1 NTU | N/A | Soil runoff | YES | |
| Lowest monthly % samples meeting limit: 100% | |||||||
Contaminants presented in the section below are monitored less than once per year. Data is from the most recent testing done in accordance with regulations | |||||||
Arsenic Most recent sample date: 8/23/2023 | ND | 8 ppb | 10 ppb | 0 ppb | Erosion of natural deposits; Runoff from orchards | YES | |
Fluoride Most recent sample date: 8/23/2023 | ND | 0.2 ppm | 4 ppm | 4 ppm | Erosion of natural deposits | YES | |
Nitrite (NO2) Most recent sample date: 8/23/2023 | ND | 0.1 ppm | 1 ppm | 1 ppm | Runoff from fertilizer use; Leaching from septic tanks, sewage; Erosion of natural deposits | YES | |
Mercury Most recent sample date: 8/23/2023 | ND | 1 ppb | 2 ppb | 2 ppb | Erosion of natural deposits; Runoff from landfills; Runoff from cropland | YES | |
Sodium Most recent sample date: 8/23/2023 | 4 ppm | 11 ppm | N/A | 20 ppm | Erosion of natural deposits | YES | |
Pentachlorophenol Most recent sample date 8/20/2025 | ND | 0.1 ppb | 1 ppb | 0 ppb | Discharge from wood preserving factories | YES | |
Distribution System
MICROBIOLOGICAL CONTAMINANTS
| Regulated Contaminant | Minimum Amount Detected | Maximum Amount Detected | MCL, Action Level, Treatment Technique or MRDL | MCLG or MRDLG | Typical Source of Substance | In Compliance? |
|---|---|---|---|---|---|---|
| Total Coliform (non-fecal) | 2 of 1,222 samples collected throughout 2025 had detectable coliform bacteria | Treatment Technique | N/A | Naturally present in the environment | YES | |
DISINFECTION BYPRODUCTS
| Regulated Contaminant | Minimum Amount Detected | Maximum Amount Detected | MCL, Action Level, Treatment Technique or MRDL | MCLG or MRDLG | Typical Source of Substance | In Compliance? | |
|---|---|---|---|---|---|---|---|
Haloacetic Acids Running annual average | 6.4 ppb | 12 ppb | 60 ppb | N/A | Byproduct of drinking water disinfection | YES | |
Haloacetic Acids Range of single results at all sites | ND | 15 ppb | N/A | N/A | Byproduct of drinking water disinfection | YES | |
Total Trihalomethanes Running annual average | 3.6 ppb | 19 ppb | 80 ppb | N/A | Byproduct of drinking water disinfection | YES | |
Total Trihalomethanes Range of single results at all sites | ND | 48 ppb | N/A | N/A | Byproduct of drinking water disinfection | YES | |
DISINFECTION RESIDUAL
| Regulated Contaminant | Minimum Amount Detected | Maximum Amount Detected | MCL, Action Level, Treatment Technique or MRDL | MCLG or MRDLG | Typical Source of Substance | In Compliance? |
|---|---|---|---|---|---|---|
Free Residual Chlorine | 0 ppm | 1.5 ppm | 4 ppm | 4 ppm | Water additive used to control microbes | YES |
High-Risk Residential Water Taps: Sampled in 2023
Copper and Lead
| Regulated Contaminant | 2023 Minimum detected | 2023 Maximum detected | 2023 90th Percentile Results | Sites Exceeding Action Level | EPA Standard: Action Level | MCLG | Typical Source of Substance | In Compliance? |
|---|---|---|---|---|---|---|---|---|
Copper | 0.02 ppm | 0.21 ppm | 0.11 ppm | 0 out of 31 (0%) | 1.3 ppm | 1.3 ppm | Corrosion of household and commercial plumbing systems; Erosion of natural deposits | YES |
Lead | ND | 1 ppb | 0 ppb | 0 out of 31 (0%) | 15 ppb | 0 ppb | Corrosion of household and commercial plumbing systems; Erosion of natural deposits | YES |
Per- and Polyfluoroalkyl Substances (PFAS)
2025 Detections at Copperstone Well #1 (Facility ID: EP-H)
Contaminants presented in this section are unregulated: See note ‘PFAS’ above
| PFAS – Unregulated contaminants | Minimum Amount Detected | Maximum Amount Detected | Average of results | In Compliance? |
|---|---|---|---|---|
Perfluoro octanoic acid (PFOA) | 3.2 ppt | 22.5 ppt | 12.7 ppt | NA |
Perfluoro octane sulfonic acid (PFOS) | ND | 3.4 ppt | 1.7 ppt | NA |
Perfluoro hexanoic acid (PFHxA) | ND | 12.9 ppt | 6.4 ppt | NA |
Perfluoro heptanoic acid (PFHpA) | ND | 10.8 ppt | 5.3 ppt | NA |
Perfluoro pentanoic acid (PFPeA) | 3.0 ppt | 21.9 ppt | 12.3 ppt | NA |
Perfluoro butanoic acid (PFBA) | ND | 5.3 ppt | 2.6 ppt | NA |
Perfluoro butane sulfonic acid (PFBS) | ND | 3.6 ppt | 1.8 ppt | NA |
Perfluoro nonanoic acid (PFNA) | ND | 2.4 ppt | 1.2 ppt | NA |
Violation of Standards
City of Bend Water had a single violation for late/nonreporting of Surface Water Treatment Rules in 2025 on August 11. The results were transmitted to Oregon Health Authority after the monthly reporting deadline. Bend Water Department returned to compliance automatically on September 5, 2025, when the following monthly report was submitted. At no time during the violation period were Bend Water customers at risk nor was the quality of drinking water compromised.
Water Sources and Treatment
Bend has two water supply sources:
- Bend Municipal Watershed The Bend Municipal Watershed, in the Tumalo Creek / Bridge Creek drainages of the Deschutes National Forest, supplies surface water.
- Deschutes Regional Aquifer The City operates 20 wells to pump groundwater from the Deschutes Regional Aquifer to supplement the surface water.
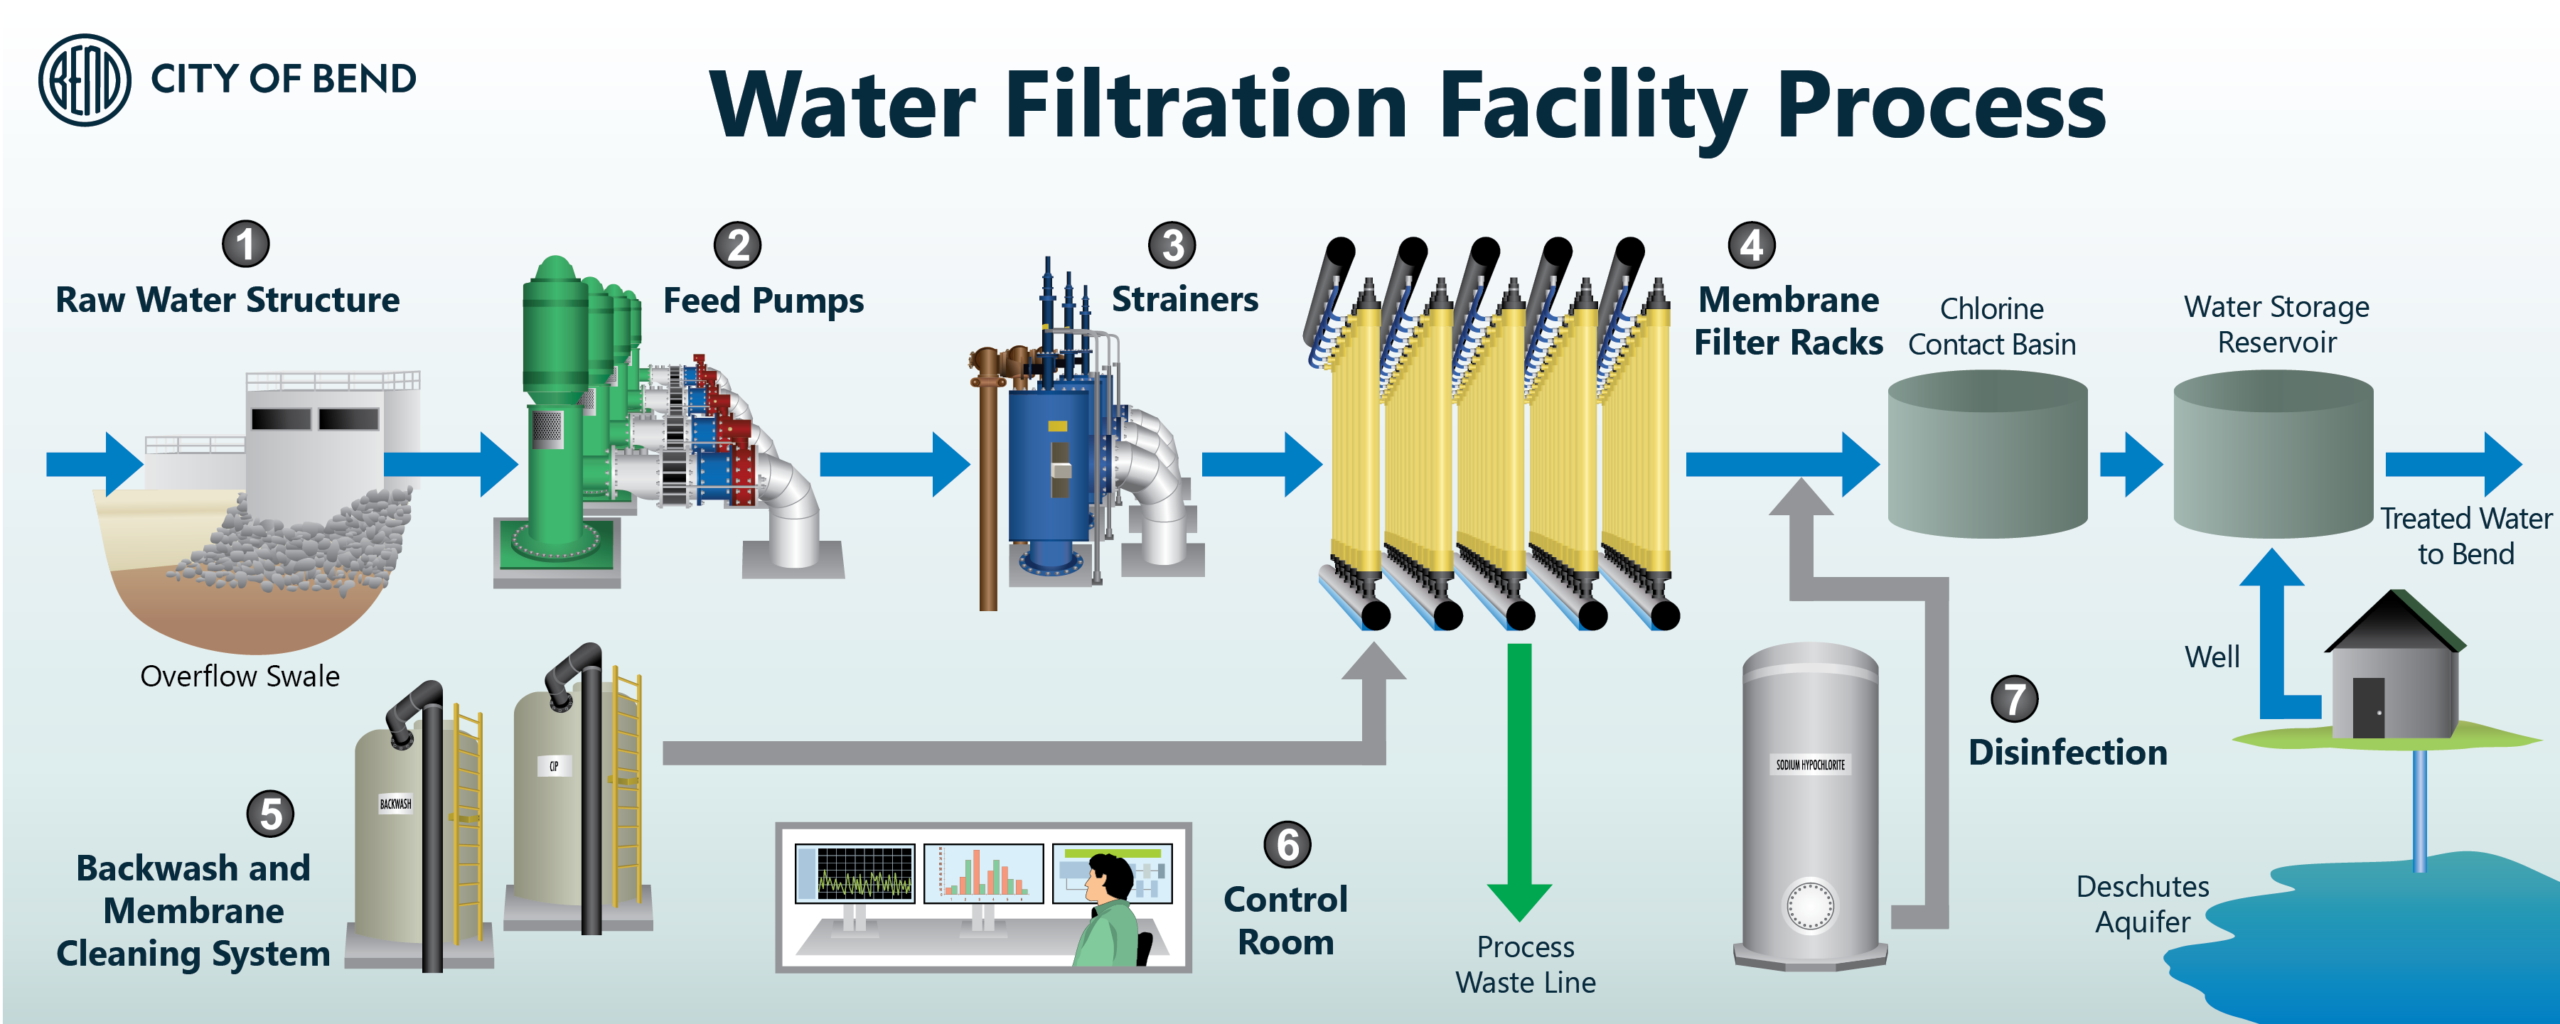
All surface water from Bend Municipal Watershed is treated, at the Water Filtration Facility by membrane filtration, which removes pathogens and other particles too small for the naked eye to see. A small amount of chlorine is added to deactivate any viruses and bacteria while keeping our network of storage tanks and pipelines clean. This image shows a snapshot of the surface water filtration process.
Bend’s water system has low potential for contamination.
Groundwater is naturally filtered by layers of soil, volcanic rock, sand, and gravel. Small amounts of chlorine are added when the water is pumped to ensure it is safe to drink and keep our distribution system of storage tanks and pipelines clean
Oregon Health Authority has determined through source water assessments that the City of Bend Water Department’s system has a low potential for contamination.
Get Involved
The Bend City Council meets on the first and third Wednesdays of each month at 6 p.m. for a Business Meeting, and on the second and fourth Wednesday of each month from 4 to 6 p.m. for a Work Session.
Questions?
Please contact us for any questions related to this report or City of Bend Water (Water System ID OR41 00100).